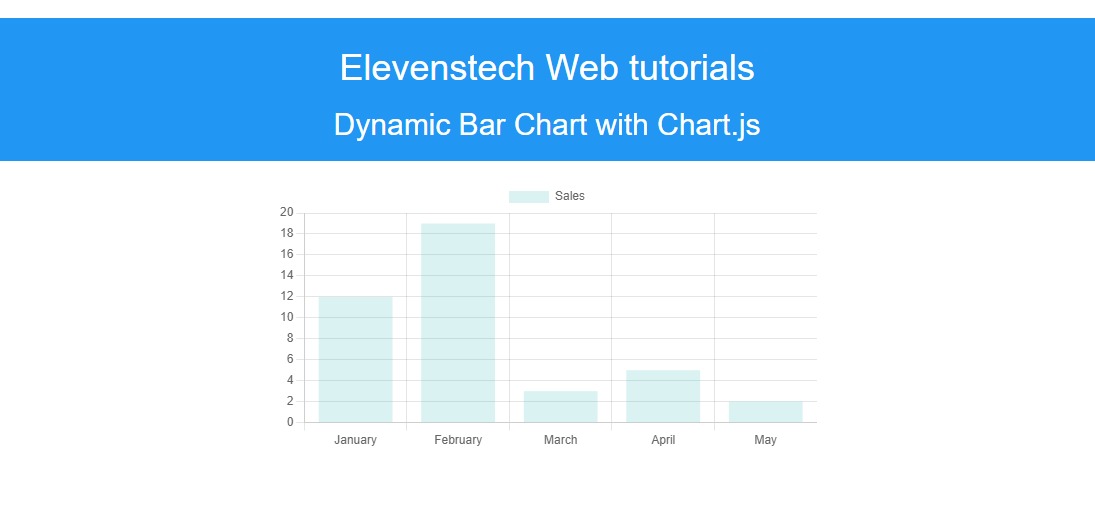
Generating Dynamic Bar Charts & Graph Reports Using Chart.js and PHP Share
Creating dynamic bar charts with Chart.js and PHP follows a similar approach to line charts. Below, I'll guide you through setting up an application that fetches data from a PHP backend and displays it using Chart.js.
Step 1: Create the PHP Backend
Create a PHP file (e.g., data.php) to serve the data:
<?php
header('Content-Type: application/json');

// Example data (you can replace this with a database query)
$data = [
    'labels' => ['January', 'February', 'March', 'April', 'May'],
    'datasets' => [
        [
            'label' => 'Sales',
            'data' => [65, 59, 80, 81, 56],
            'backgroundColor' => 'rgba(75, 192, 192, 0.2)',
            'borderColor' => 'rgba(75, 192, 192, 1)',
            'borderWidth' => 1
        ],
    ],
];

echo json_encode($data);
?>
Step 2: Create the Frontend
<!DOCTYPE html>
<html lang="en">
<head>
    <meta charset="UTF-8">
    <meta name="viewport" content="width=device-width, initial-scale=1.0">
    <title>Dynamic Bar Chart with Chart.js - Elevenstech</title>
    <script src="https://cdn.jsdelivr.net/npm/chart.js"></script>
    <style>
        canvas {
            max-width: 600px;
            margin: auto;
        }
    </style>
</head>
<body>
    <h1>Dynamic Bar Chart</h1>
    <canvas id="myChart"></canvas>

    <script>
        async function fetchData() {
            const response = await fetch('data.php');
            const data = await response.json();
            return data;
        }

        async function renderChart() {
            const chartData = await fetchData();
            const ctx = document.getElementById('myChart').getContext('2d');
            const myChart = new Chart(ctx, {
                type: 'bar',
                data: {
                    labels: chartData.labels,
                    datasets: chartData.datasets,
                },
                options: {
                    responsive: true,
                    scales: {
                        y: {
                            beginAtZero: true
                        }
                    }
                }
            });
        }

        renderChart();
    </script>
</body>
</html>
Example Database Integration
<?php
header('Content-Type: application/json');

$mysqli = new mysqli("localhost", "username", "password", "database");

if ($mysqli->connect_error) {
    die("Connection failed: " . $mysqli->connect_error);
}

$result = $mysqli->query("SELECT month, sales FROM sales_data");
$labels = [];
$data = [];

while ($row = $result->fetch_assoc()) {
    $labels[] = $row['month'];
    $data[] = $row['sales'];
}

echo json_encode([
    'labels' => $labels,
    'datasets' => [[
        'label' => 'Sales',
        'data' => $data,
        'backgroundColor' => 'rgba(75, 192, 192, 0.2)',
        'borderColor' => 'rgba(75, 192, 192, 1)',
        'borderWidth' => 1
    ]],
]);

$mysqli->close();
?>



 Click to Join


Comments 0